
Animated: The Rise & Fall of the Largest Cities in the World, from 3,000 BC to the 2020s
This is the first era of human history when more of us live in cities than not. That’s what we’ve often been told in recent years, at least, though the specifics do depend on what kinds of urbanized areas you count as proper cities. Still, this would seem to mark an important inflection point in human history, the past five millennia of which has also been the history of great cities rising and falling, in absolute terms but also relative to one another in size, power, and influence. You can see this animated in the video above from cartographical-historical Youtuber Ollie Bye, previously featured here on Open Culture for his visualizations of the history of London, of the British Empire, and of the entire world.
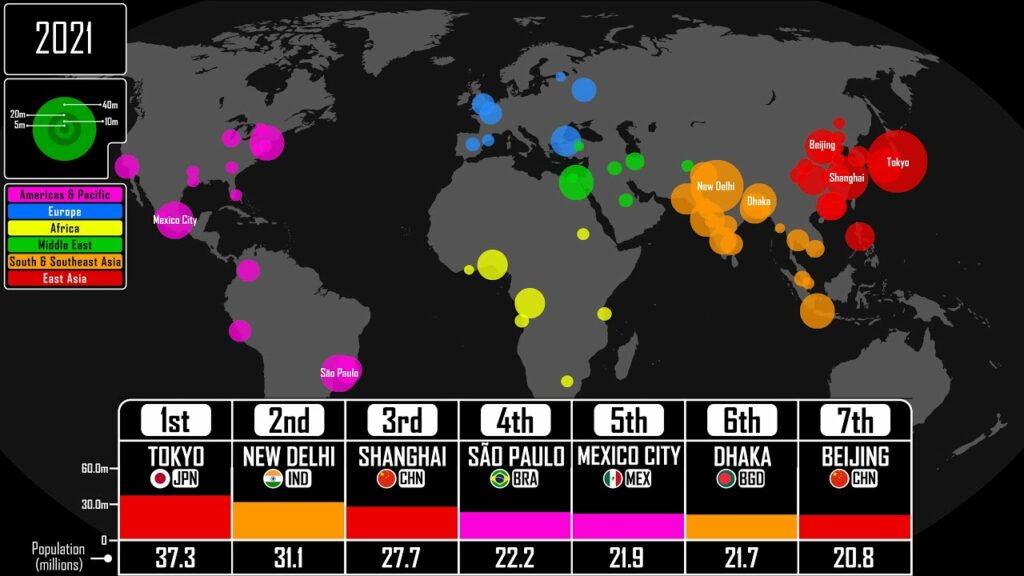
Here, Bye charts the largest cities in the world between the year 3000 BC and today, indicating their size on the map while also ranking them on an ever-changing leaderboard below. Out front in the very beginning was Uruk, capital of the Mesopotamian cradle of civilization (and a prominent location in the Epic of Gilgamesh).
A thousand years later, it was the Egyptian capital of Thebes; a thousand years after that, it was the later Egyptian capital of Alexandria. From that point on, the shuffle at the bottom of the screen grows more and more rapid: the title of largest city in the world is lost by Constantinople to Ctesiphon; by Lin’an, briefly, to Cairo, and then to Hangzhou; by London to New York.
It was in the nineteen-fifties that Tokyo — a city left in shambles by the Second World War a decade earlier — overtook New York for the top spot. There it has remained ever since, seeing off such different challengers in different eras as Osaka, Mexico City, and New Delhi. When Bye’s animation leaves off, in 2021, that last has a population of 31.1 million against Tokyo’s 37.3 million. Whether the Japanese capital has proportionately more power or influence in the world today than Beijing, São Paulo, or Los Angeles is, of course, a separate and less objective question. But no visitor to Tokyo can deny that it must have achieved something like the pinnacle of urban civilization per se — and has somehow kept the rents reasonable to boot.
Related content:
Timelapse Animation Lets You See the Rise of Cities Across the Globe, from 3700 BC to 2000 AD
The Growth of London, from the Romans to the 21st Century, Visualized in a Time-Lapse Animated Map
Watch the Rise and Fall of the British Empire in an Animated Time-Lapse Map ( 519 A.D. to 2014 A.D.)
The Entire History of the British Isles Animated: 42,000 BCE to Today
The History of the World in One Video: Every Year from 200,000 BCE to Today
A Wonderful Archive of Historic Transit Maps: Expressive Art Meets Precise Graphic Design
Based in Seoul, Colin Marshall writes and broadcasts on cities, language, and culture. His projects include the Substack newsletter Books on Cities, the book The Stateless City: a Walk through 21st-Century Los Angeles and the video series The City in Cinema. Follow him on Twitter at @colinmarshall or on Facebook.